Russia will once again take the leading position in the world in the supply of wheat.
In the past agricultural year, Russia exported 48,074 thousand tons of grain through the seaports.
Data on current shipments in the ports of Russia, historical data on grain shipments since 2012 can be generated on the basis of the analytical platform Operational system for analytics AGRO export (logisticos.ru ) .
The system consists of several modules: Line-up , Export Date , Ratings , Ports , Cargo , Shippers , as well as a large number of directories.
Users are given the opportunity to use various analytical tools and download data in the format Excel.
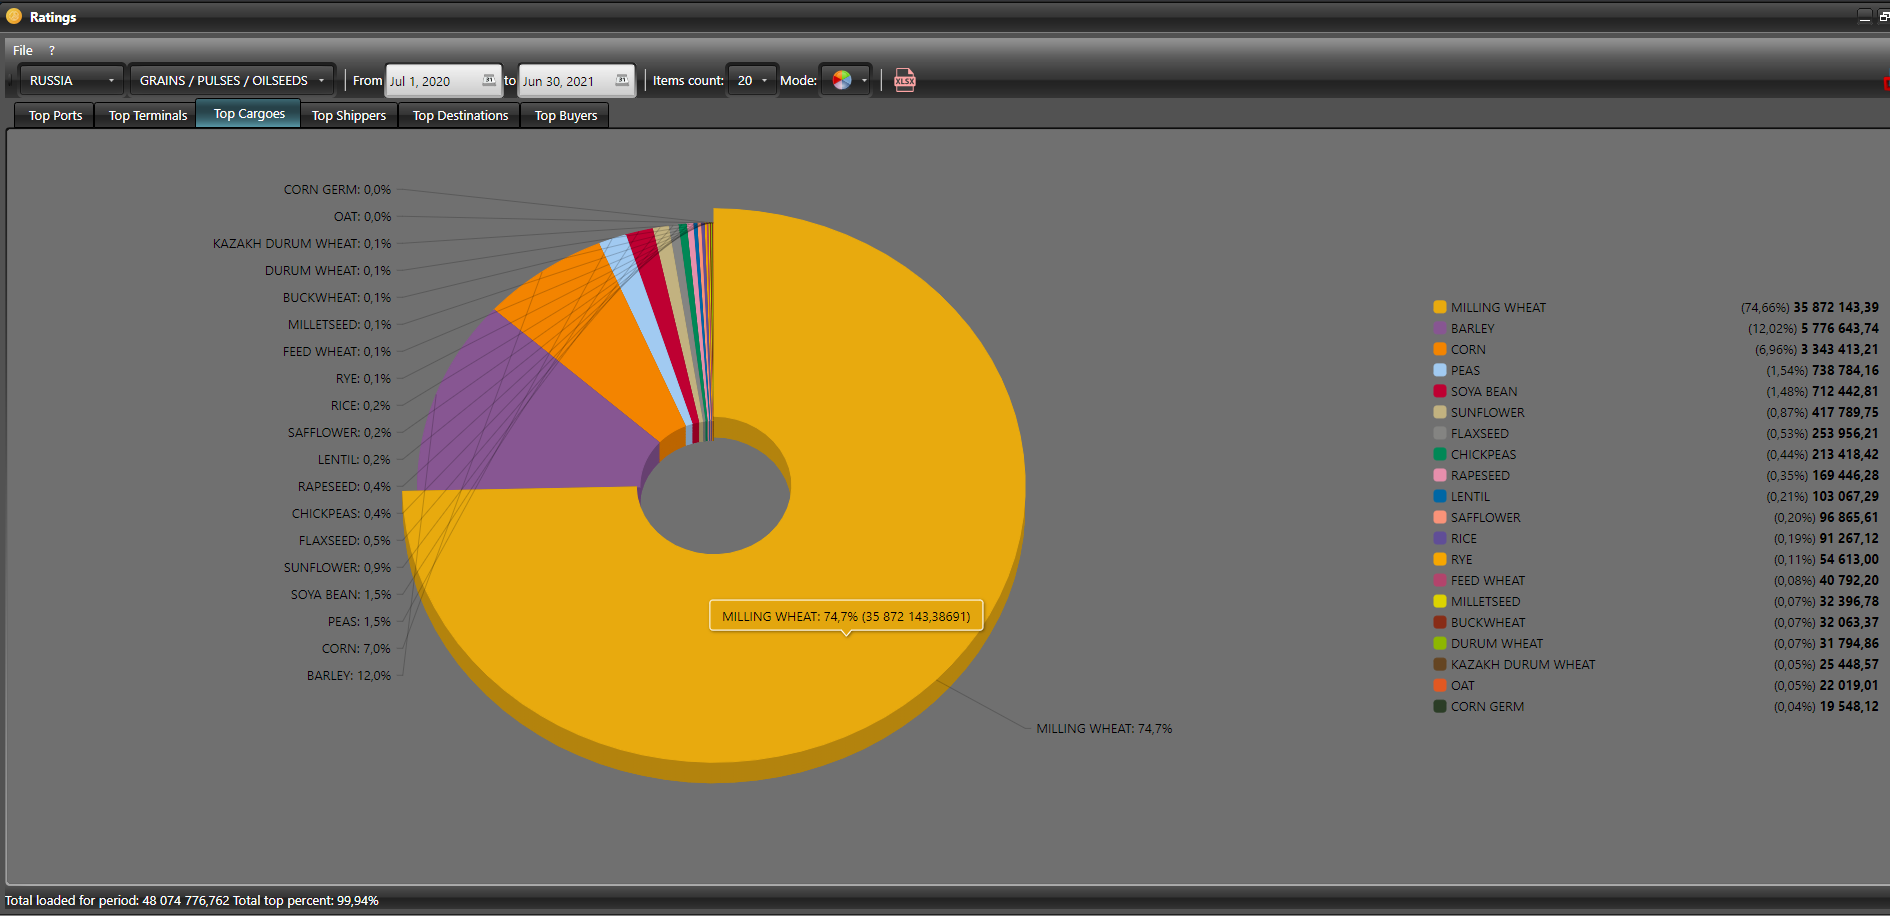
When there is a need to obtain comparative data in the form of ratings, then in the Ratings module, you need to select a country, type of cargo and the required period of time ( in this case from 01 July 2020 to 30 June 2021.
The resulting diagram shows which grain cargo and in what volume were exported through the seaports of Russia.
(to get free test access, follow the link )
Infrastructure changes that have occurred over the past year have made it possible to ship record volumes of grain almost every month of the 2020/21 season until February 2021.
The introduced duties on the export of wheat sharply suspended its shipments, and only the entry into force of the rules for shipment, taking into account the «floating» duty, significantly increased exports in June, which, according to its results, even surpassed the indicators of June of the record 2017/2018 agricultural year.
Platform Logistic OS allows you to compare shipment data for different periods.
For this purpose, you can use the module E export Date , where you also need to select a country, type of cargo and period for analytics.
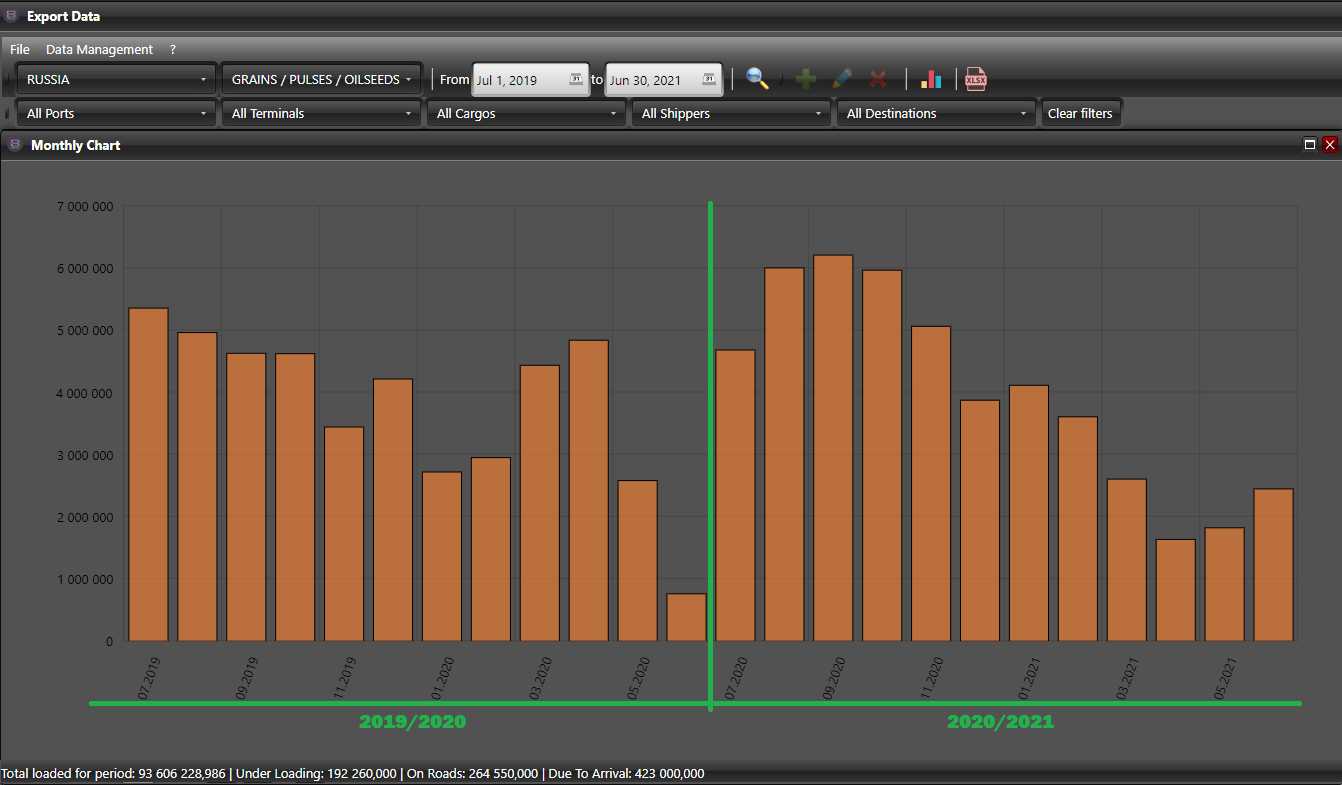
Using this module, it is possible to carry out analytics for a specific cargo, for example, wheat.
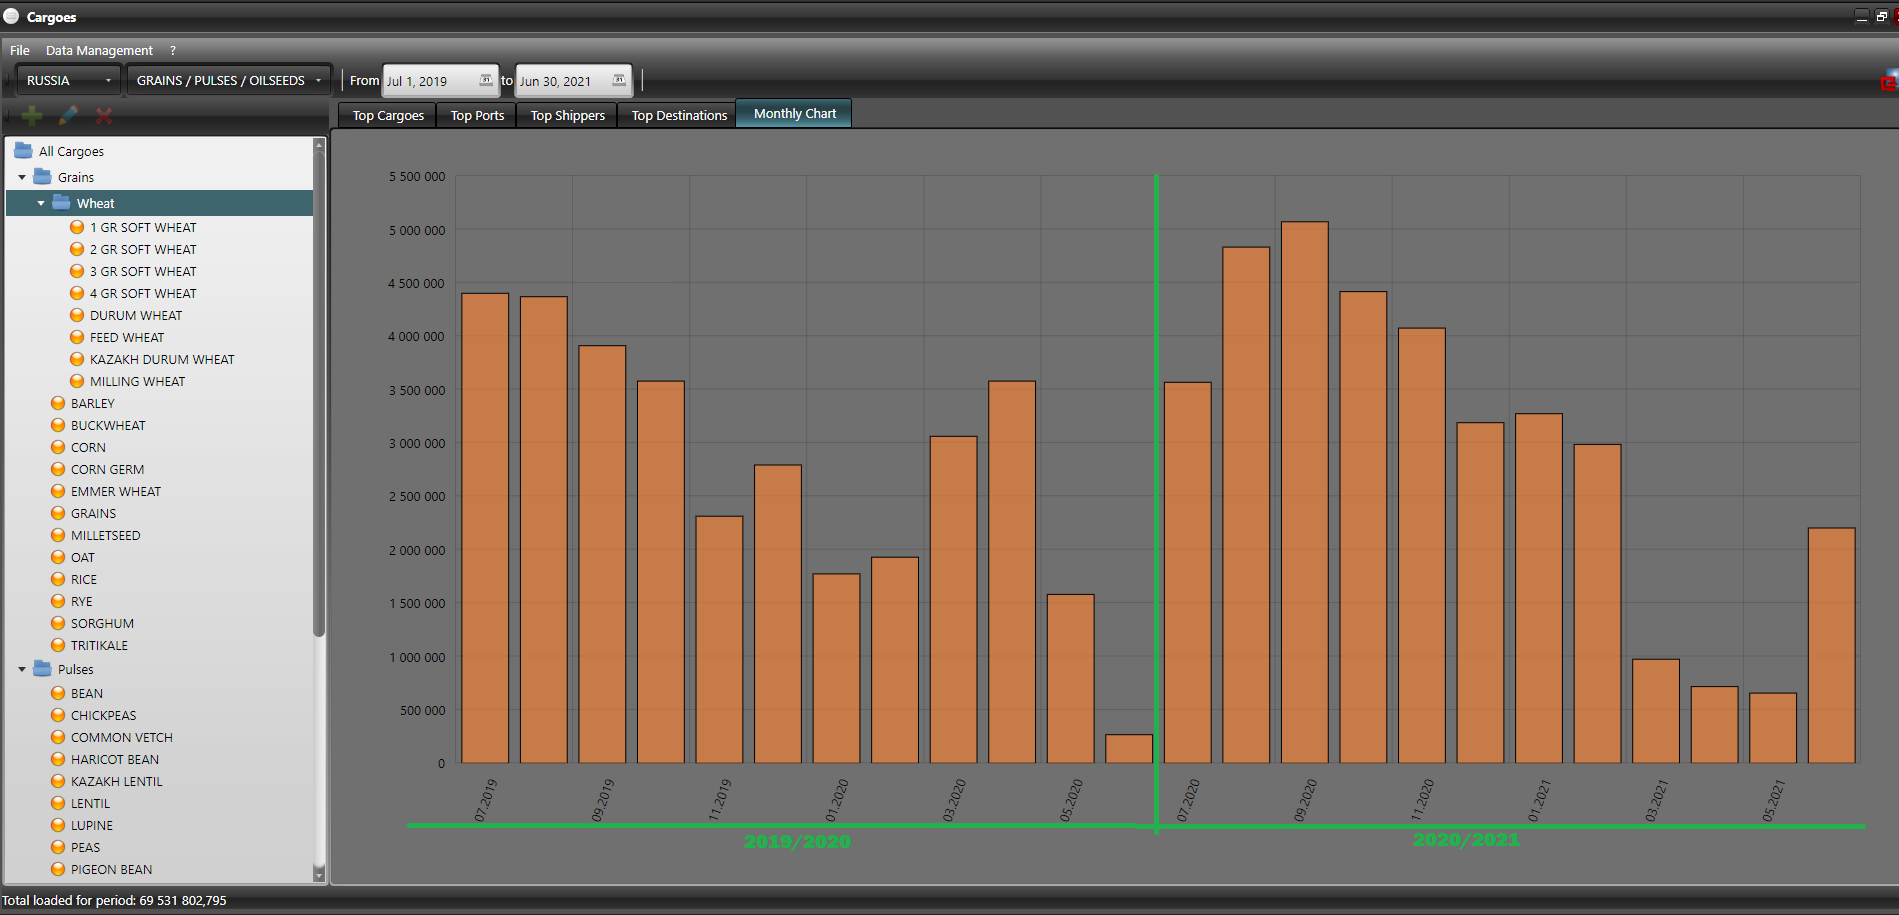
To obtain such data, we will use the module Cargo , where we will choose wheat as the cargo, we will choose the time period from 01.07. 2019 to 06/30/2021 and form analytics in the form of a chart similar to the chart we have chosen in the module Export Date .
The resumption of supplies to countries to which shipments were suspended and the opening of new directions slightly changed the structure of importing countries.
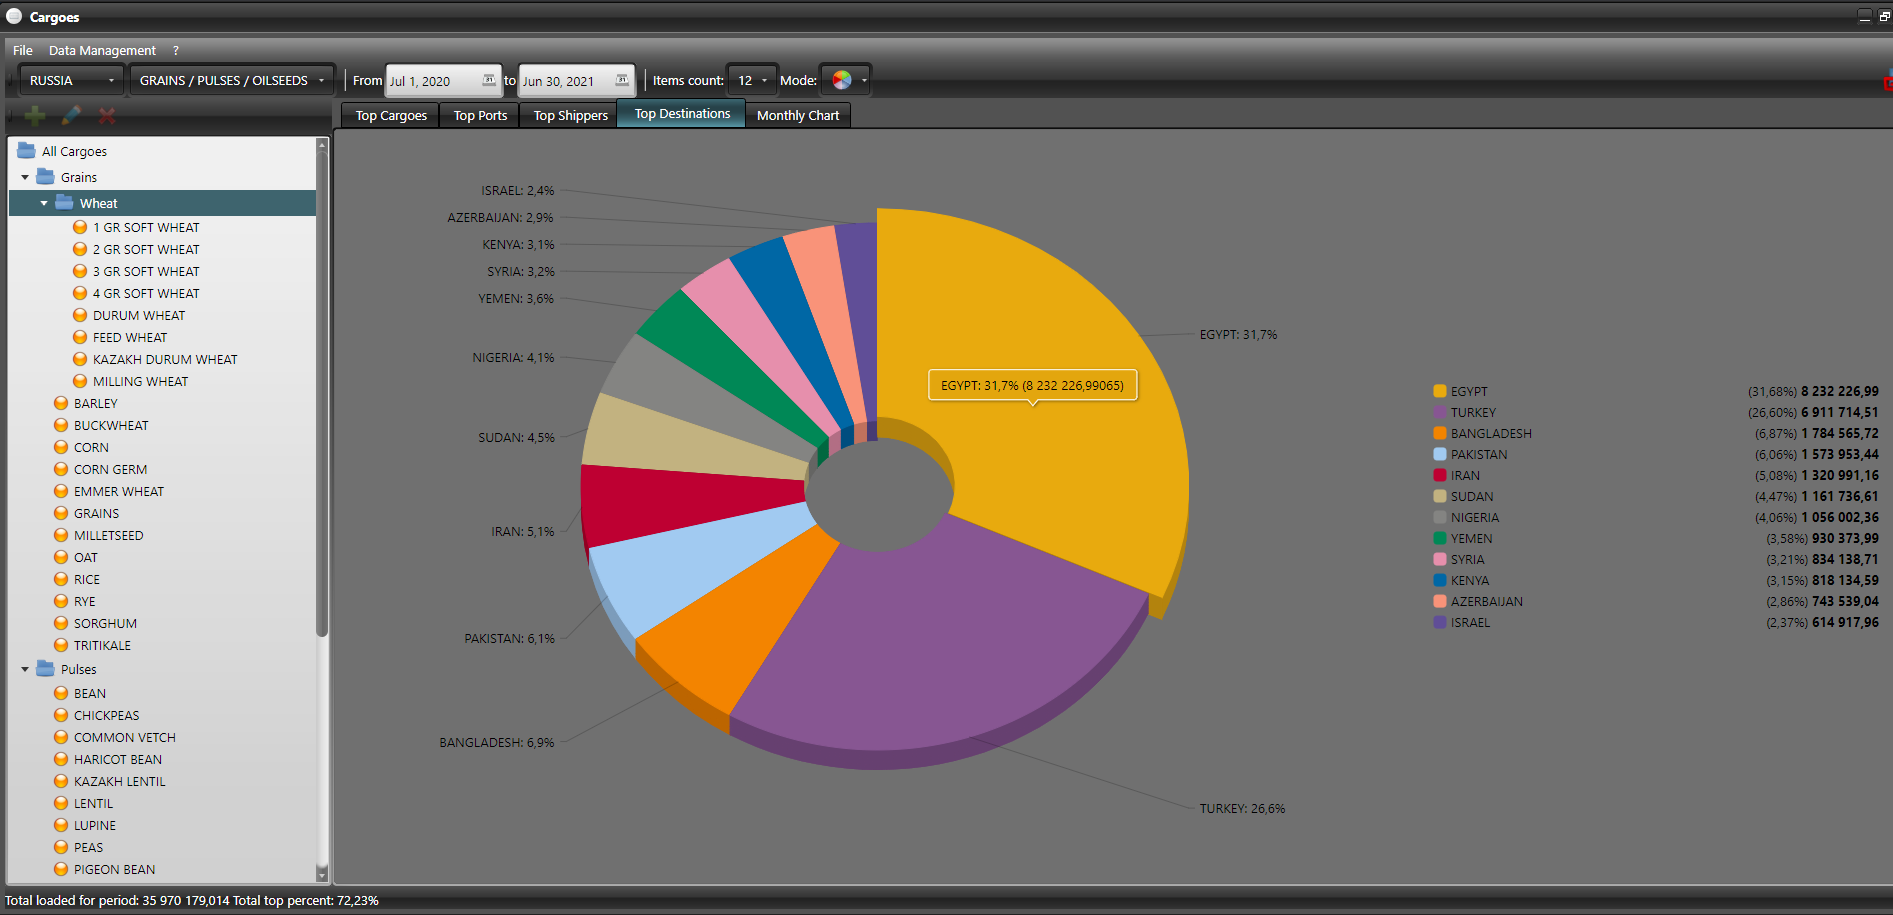
Egypt displaced Turkey from the first place, shipping more than 8 million tons of wheat, increasing the volume of imports of this crop from Russia by almost 45%, which allowed Russia to occupy 63% of the Egyptian market after a 50% share in 2019 / 20- m.
The growth of its own harvest and the devaluation and unstable exchange rate of the lira did not lead Turkey to an increase in the volume of shipments through the seaports and left it in second place in the ranking. At the same time, the share of Russia in Turkey’s imports is still 69%.
The third place is steadily occupied by Bangladesh , but the renewed supplies to Pakistan immediately allowed this country to become the fourth among importers.
More than 1.5 million tons of wheat were purchased, and Russia’s share in Pakistan’s wheat imports was 38%.
On the platform Logistic OS , you can analyze analytical data on cargo, importing countries, exporters in various modules: Export Date, Ratings , Countries, Freights, Shippers. We used a filter in the Cargo module.
Last year, unfavorable weather conditions reduced both production and supply from Russia’s competing countries.
Some previously self-sufficient countries, such as Pakistan, have entered the procurement market.
Together with the growth in demand and the reduction in supply, this created conditions for the growth of world prices in the past season.
In fact, from July to December 2020, Russia became the only major importer that consistently shipped abroad.
In the second half of the agricultural year, China became an additional factor supporting high world prices, which was actively increasing purchases of fodder crops against the backdrop of a recovery in the pig population.
All this allowed Russia to steadily increase the rate of grain shipments and exceed the indicators of the last agricultural year, taking into account only exports through seaports, by more than 5%.
If you want to learn more about the analytical platform Logistic OS , follow the link Trial version | Logistic OS and get a free trial access for 1 month.