Getting to know the program’s capabilities. Part 3.
Read part 1. Introduction
Read part 2. Grain export data: Russia, Ukraine, Romania, Bulgaria
What is the module Line — up ?
This is the monitoring of the movement of ships and goods in the ports of Russia, Ukraine, Romania and Bulgaria.
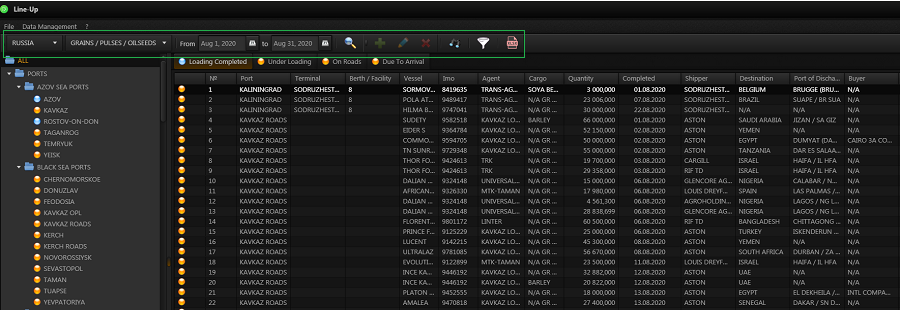
This is the interface of the Line-up module.
The work in the module is carried out using the tools of the upper control panel.
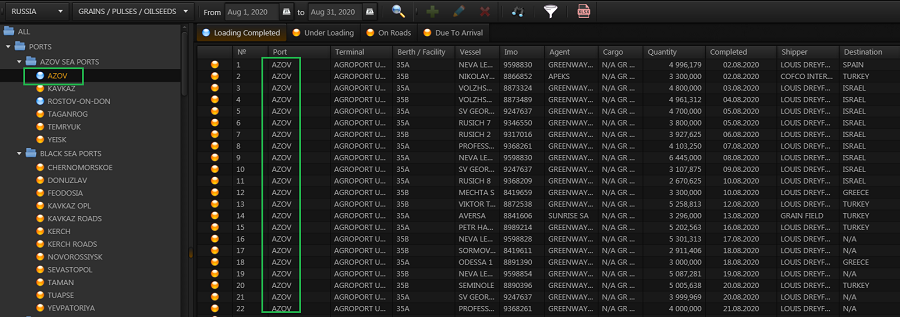
Before starting work, you need to select a country, after which a list of ports belonging to the selected country and formed in the form of a logical tree for quick search will appear on the left side of the interface:
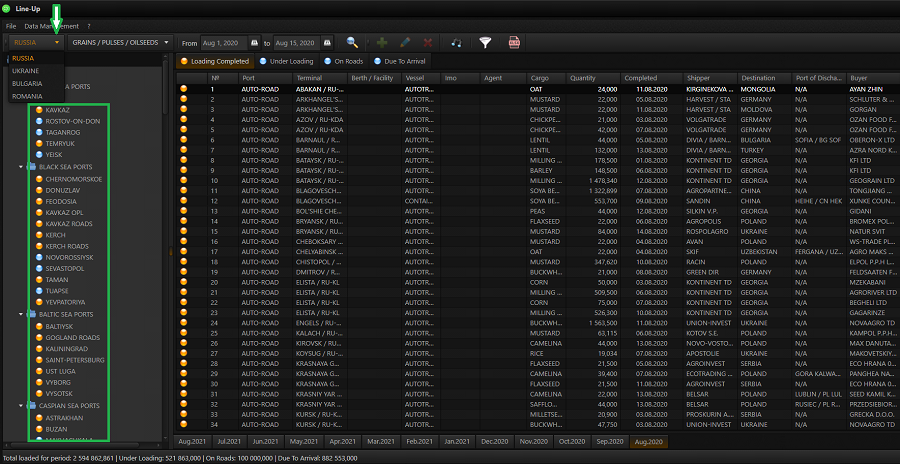
The search tree consists of three main groups, each of which is additionally divided into subgroups for the ability to quickly obtain data on a specific basis:
— PORTS
— INTERMEDIATE TRANSHIPMENT
— TRANSPORTATION BY LAND TRANSPORT (OVERLAND)
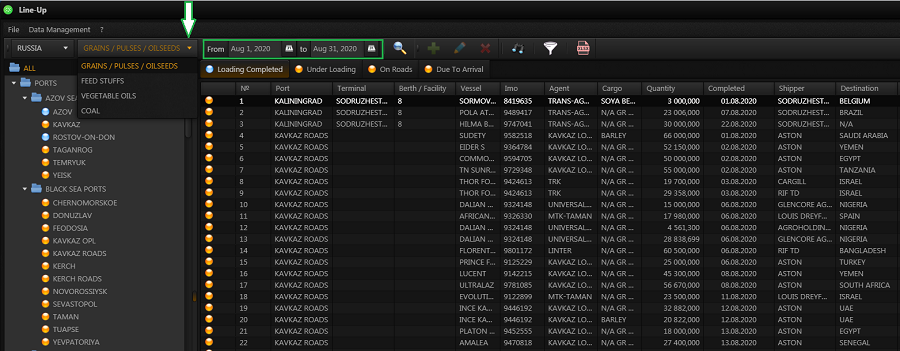
Further, in the drop-down window, select the category of goods for which you will conduct analytics, and the time period of interest:
To quickly switch between data for each month for the last year, use the menu bar at the bottom of the page:
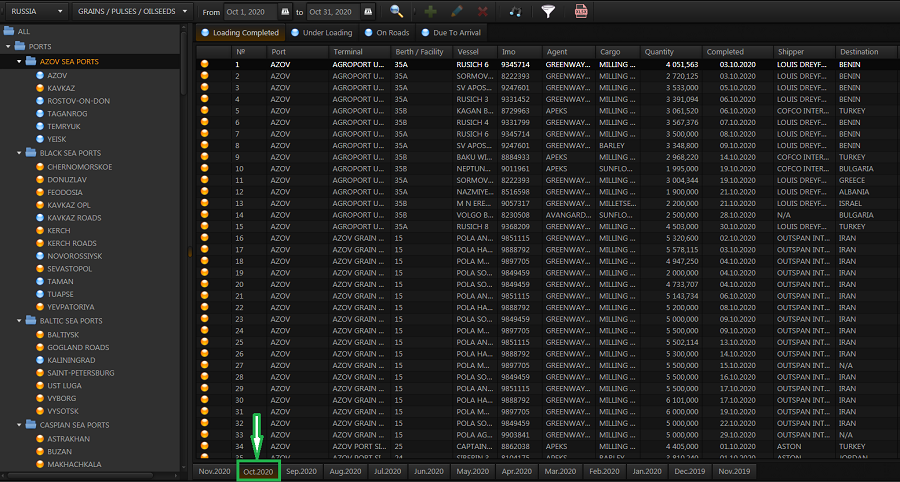
Selecting the port or group of ports you are interested in on the left side of the interface (based on the ports belonging to the basins of the seas or rivers, for example, AZOV SEA PORTS, DON RIVER PORTS, etc.), you will receive complete data on the transshipment of goods in this region:
Due To Arrival List
List of ships in the roads (On Roads)
List of vessels under loading
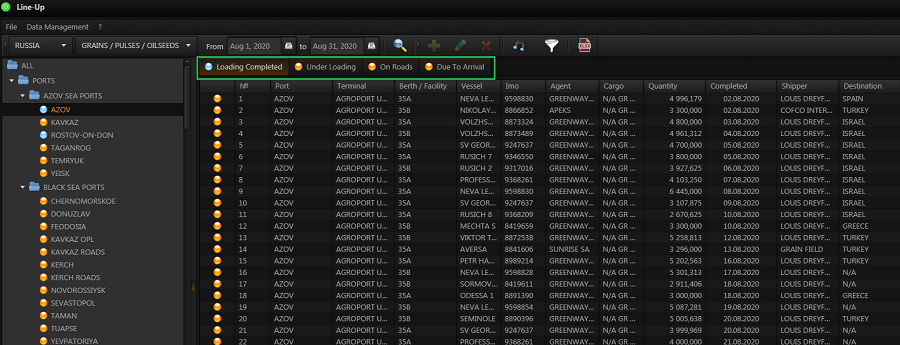
List of vessels that have completed loading (Loading Completed).
Use the tabs in the second menu bar to see which ships are on their way, at roadstead, loading or having finished loading.
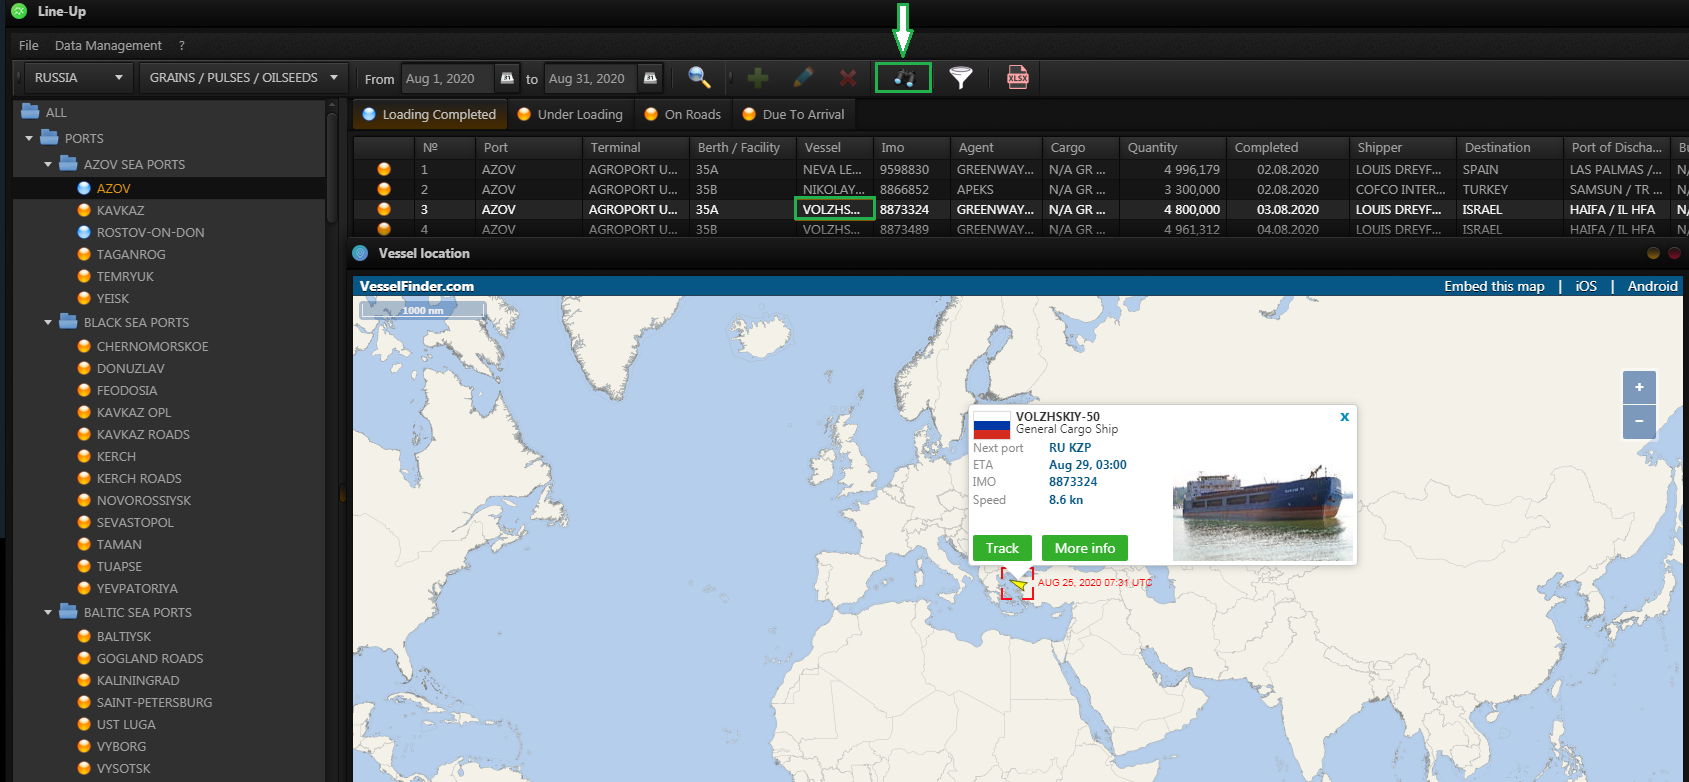
Also, users have the opportunity to see the location of any vessel in real time.
To do this, select the name of the vessel and click on the «binoculars» icon in the second menu line.
In addition to the ability to select data for an individual port or group of ports, through the search tree, you can quickly generate, for example, a list of all ships sent to the Caucasus roadstead for subsequent transshipment (see the TRANSHIPMENT group) or a list for export by road or rail (see the OVERLAND group ).
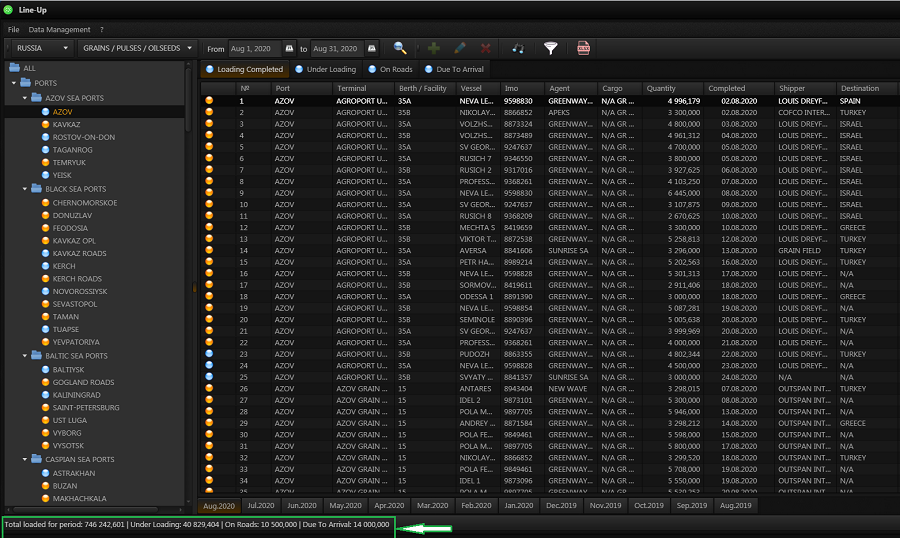
Depending on the data you have selected, the bottom line of the interface displays summary data on the total amount of cargo.
You can independently select the data you need and generate a report using the filter block by pressing the «filter» key in the first menu bar, or open this block by double-clicking on any column.
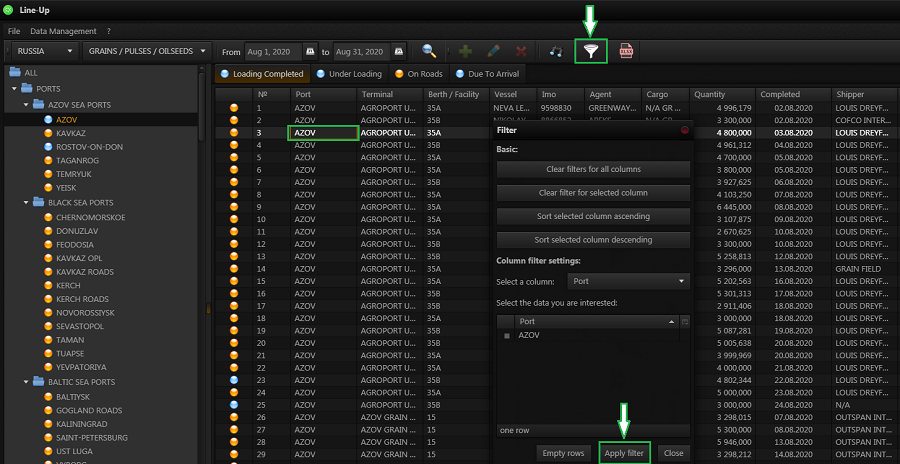
After selecting the necessary filters, press the «Apply filters» button.
In the drop-down list, select the top line and select the year for downloading the archived report.
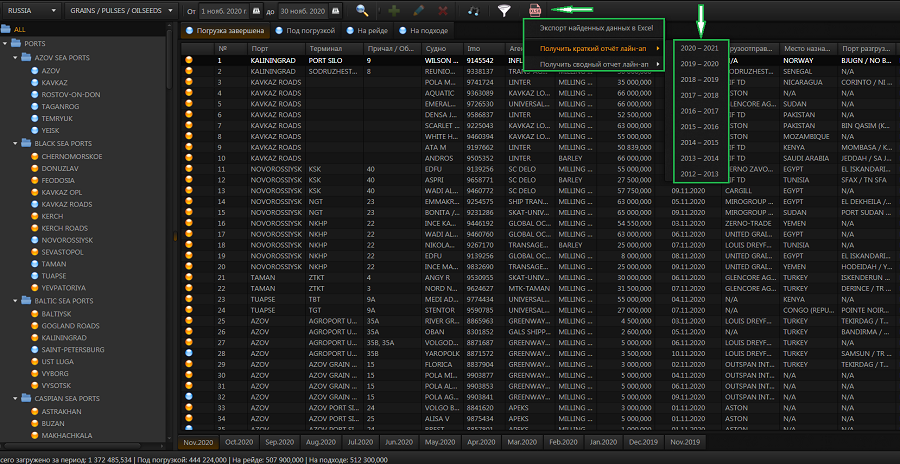
The report is created by the managers of our company and is archived for the seasons of previous years or is generated daily for the current season and is not tied to the dates you specified when working in the module.
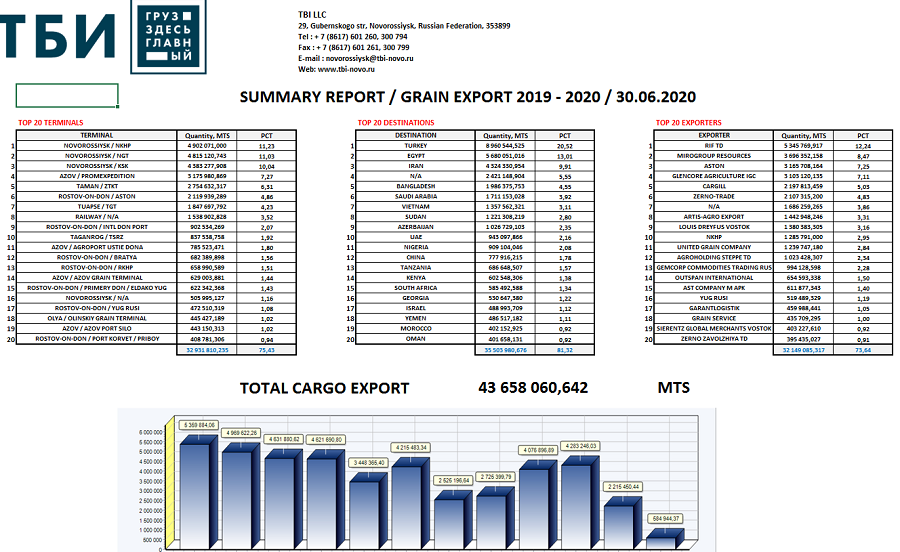

The report will contain information on TOP — 20 ports, cargoes, terminals, exporters and countries where the cargo was sent.
More details on the functionality of the platform modules can be found at the link
To get free trial access for 1 month, follow the link .