Analyzing the situation with export deliveries of agricultural products from Russia, experts note a significant decline.
General results of the first week of agricultural year in the country:
In the first week, only 98,000 tons of wheat were exported. This indicator shows a decline in exports over the same period last year by 61%. (Data are given on the basis of issued phytocertificates).
If you look in more detail, then 76 thousand tons were shipped barley (-4% compared to last year), 9 thousand tons of wheat bran (-3%), and 5 thousand tons of barley malt (a 5-fold increase).
Oilseeds and their processed products: 30 thousand tons of soybeans (10% growth), 11 thousand tons of sunflower meal (-44%), 5 thousand tons of rapeseed meal (+ 100%).
From July 1 to July 7, Russia exported 310 thousand tons of grain and oilseeds and their processed products, which is 40% lower than last year.
Products were shipped to 48 countries. In comparison: in 2019, the number of importing countries was 57.
Using the capabilities of the services of the analytical program Logistic OS, we analyze the data obtained by the middle of the first month of the new agricultural year and compare it with the same period last year.
We use the application “Export Data”
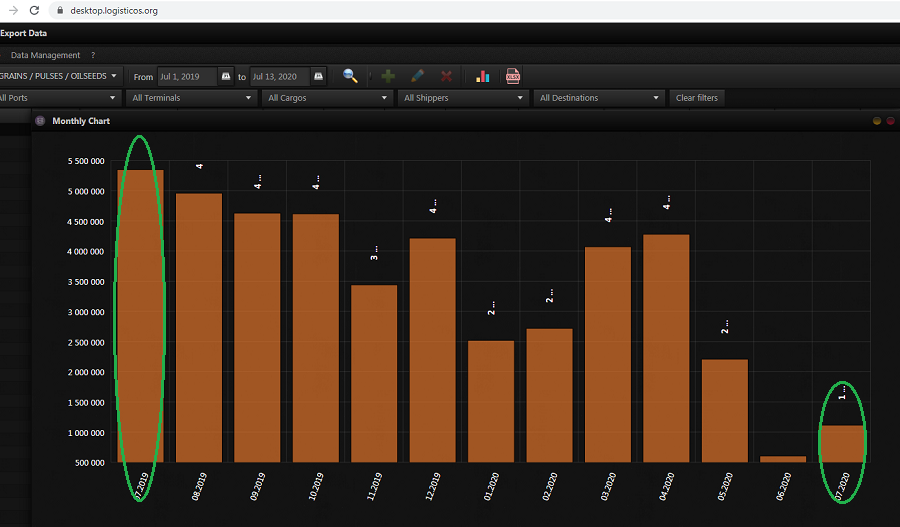
According to the platform, for the first half of July 2019, grain products were exported in the amount of 1,549,538 tons.
For the same period of this year, 1,121,868 tons.
Thus, the decline in exports at the moment is 27.5%.
Let us take into account that the harvest this year due to weather conditions has been shifted, and so far the lag is not so irreparable.
But the alarm bell has already sounded.
By feed export:
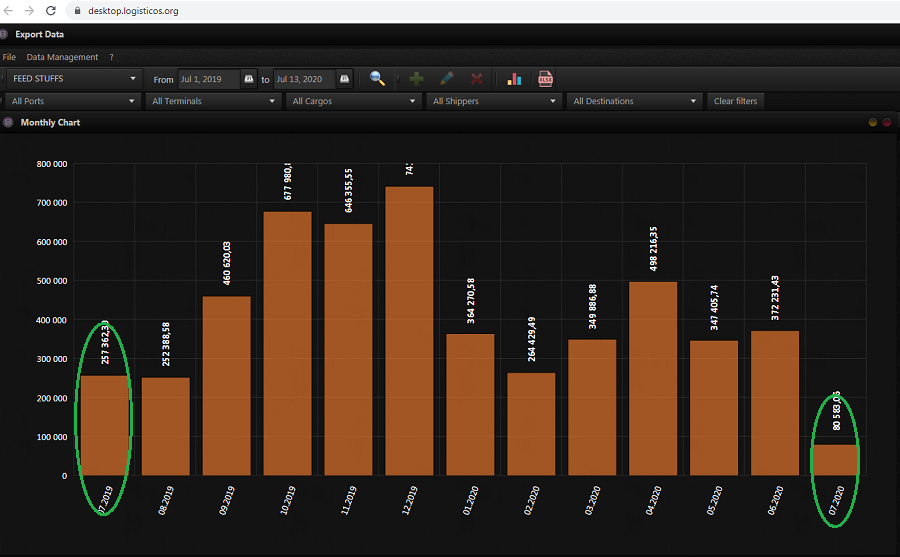
2019 — 80,467 tons
2020 — 80 583 tons. Growth 0.144%
Export of oil and fat products:
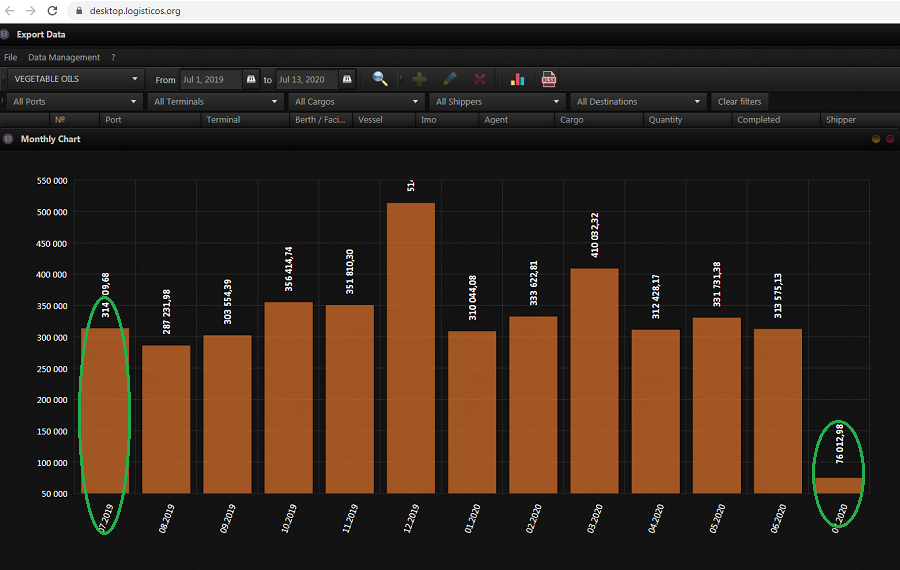
2019 — 91 189 tons
2020 — 76 012 tons. Drop 16.6%
Compared with 2019, the TOP-3 ports have also changed.
TOP-3 grain shipping ports (% of total):
2019
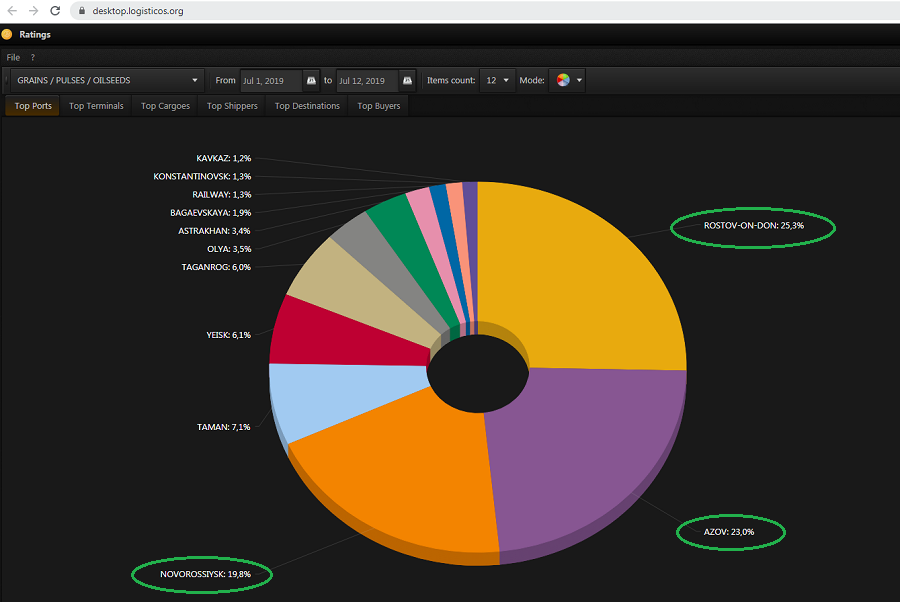
Rostov-on-Don — 25.32%
Azov — 23.04%
Novorossiysk — 19.79%
2020
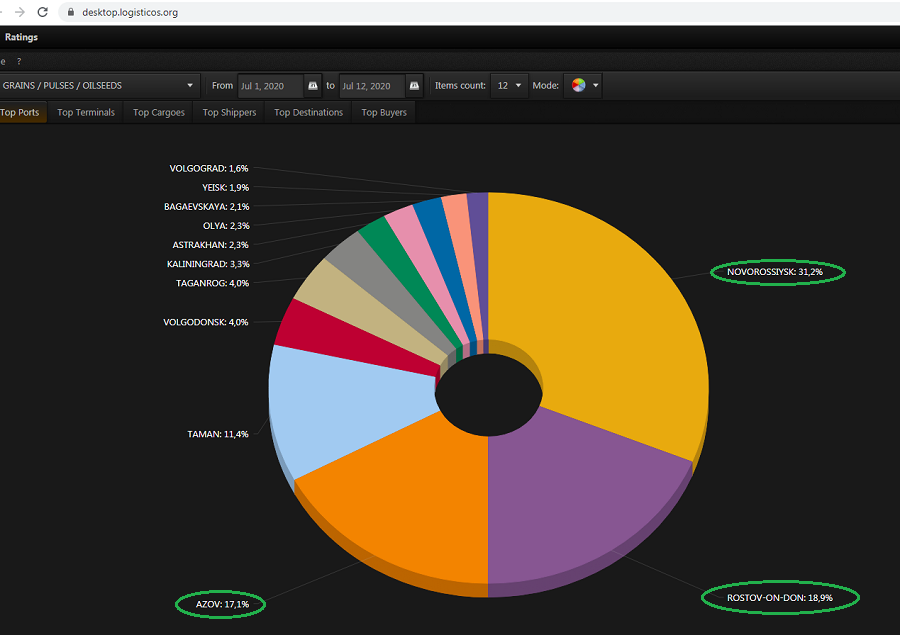
Novorossiysk — 31.2%
Rostov-on-Don — 18.85%
Azov –17.14%
TOP-3 ports for oil and fat products shipment (% in total):
2019
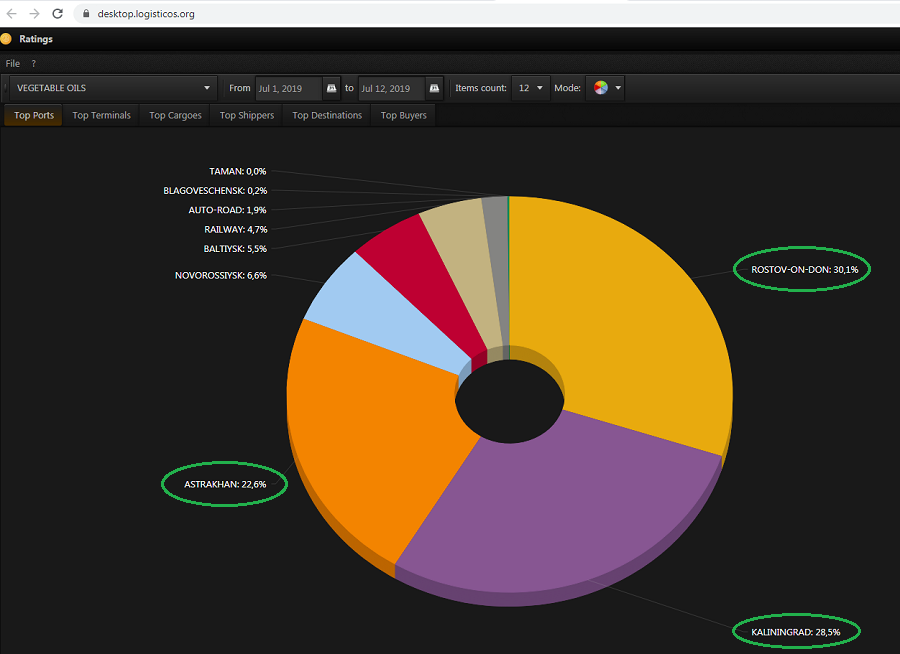
Rostov-on-Don — 30.06%
Kaliningrad — 28.51
Astrakhan — 22.65
2020
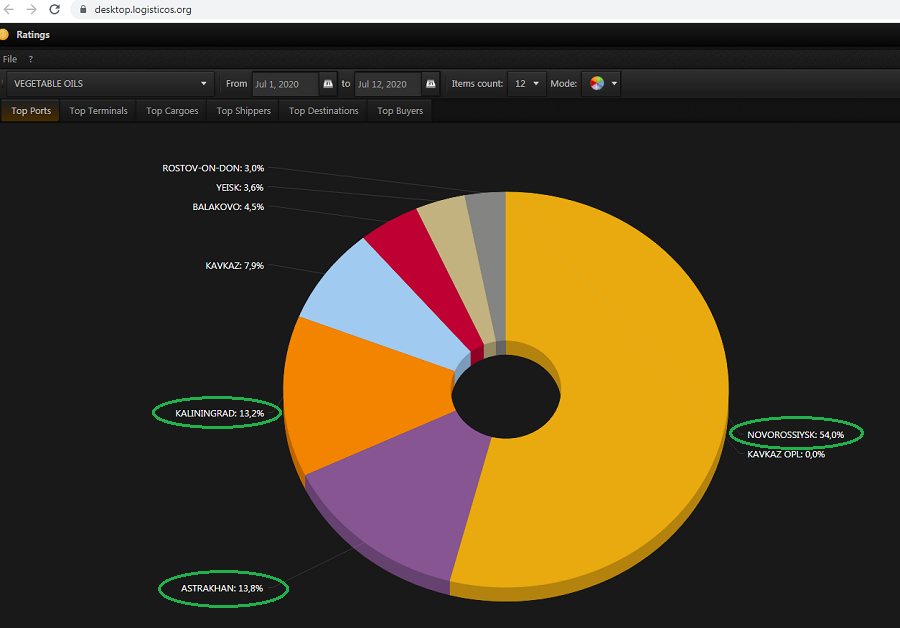
Novorossiysk — 54.0%
Astrakhan — 13.8%
Kaliningrad — 13.2%
TOP 3 feed shipment (% of total)
2019
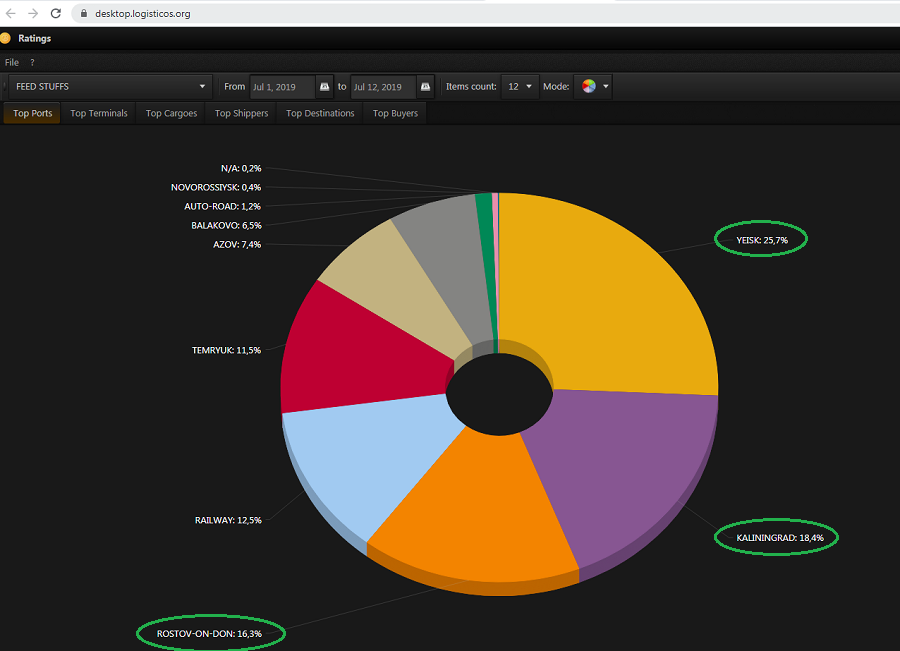
Yeysk — 25.68%
Kaliningrad — 18.39%
Rostov-on-Don — 16.26%
2020
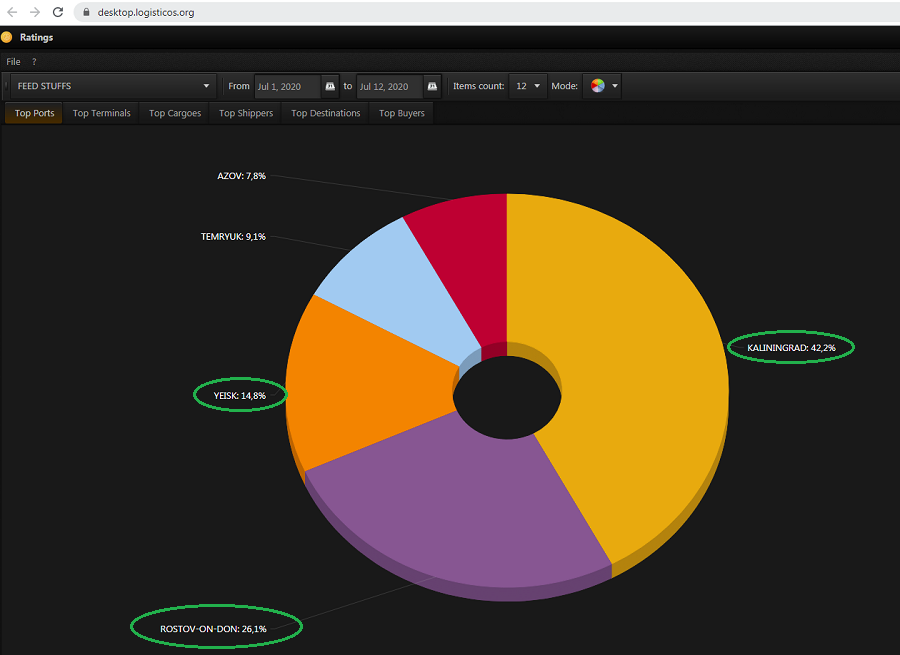
Kaliningrad — 42.19%
Rostov-on-Don — 26.05%
Yeysk — 14.85%
The Logistic OS platform enables its users to have the most up-to-date analytical information.