The Line-Up application allows for daily monitoring of the movement of ships and goods in Russian ports.
The information in the application is updated daily as the situation changes in real time.
With the help of this application, you can get information on ships on the way to ports, in roadsteads in ports, standing under loading and having finished loading.
To work with any analytical applications, you need to get access to work with the platform.
To do this, send an application for either test access, or purchase a subscription to use the platform on an ongoing basis. This can be done on the home page of the site Logistic OS
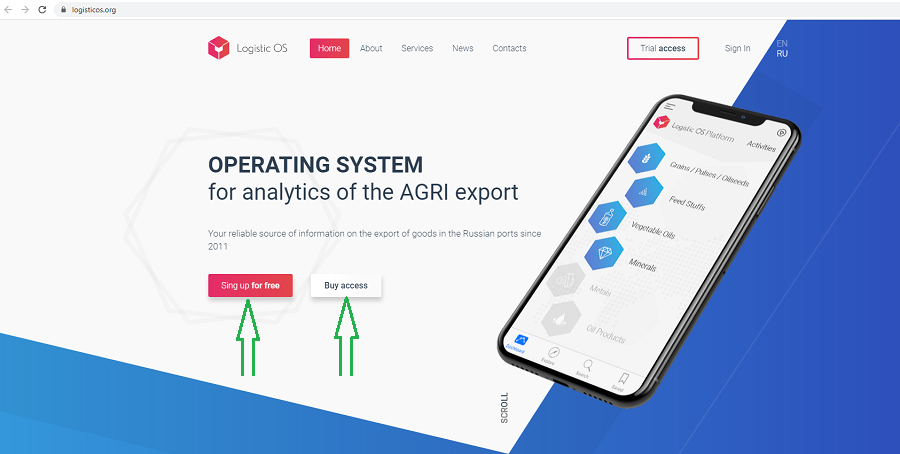
Then, having received your login and password, select the language you need and log in to the platform.

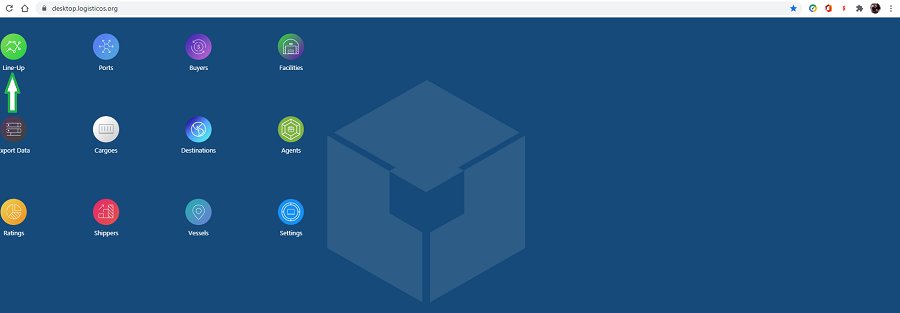
You will be taken to the platform’s main page, where you need to select the Line-up application.
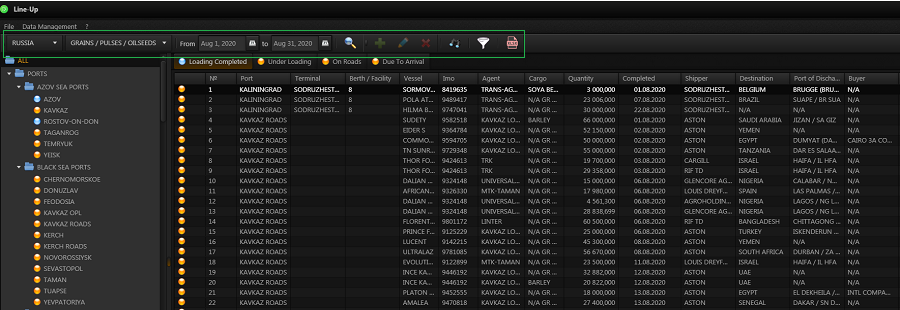
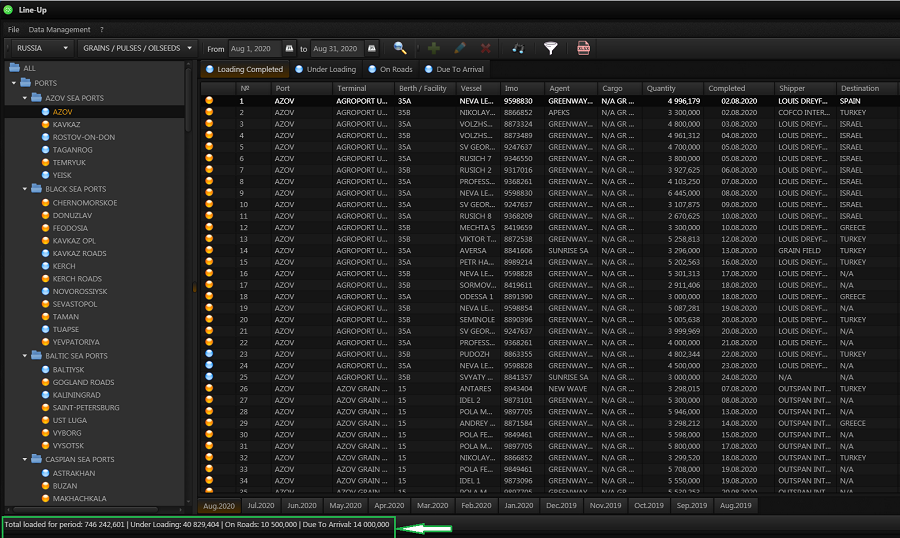
The following interface will open, working with it using the toolbar:
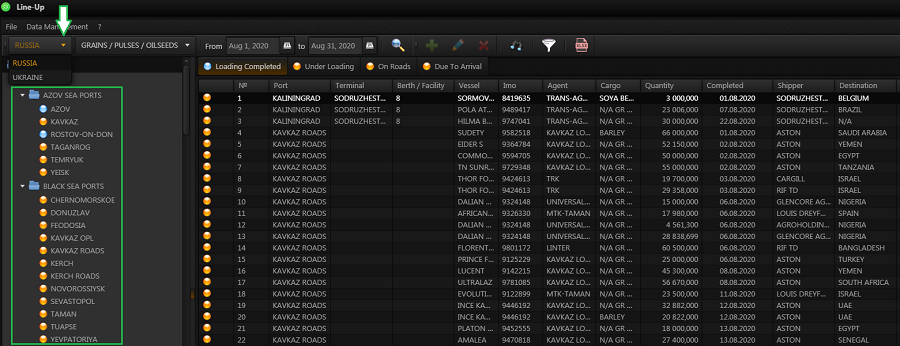
You need to select a country, after which on the left side of the interface you will see a list of ports in the form of a tree, belonging to it:
Further, in the drop-down window, select the category of goods for which you will conduct analytics, and the time period:
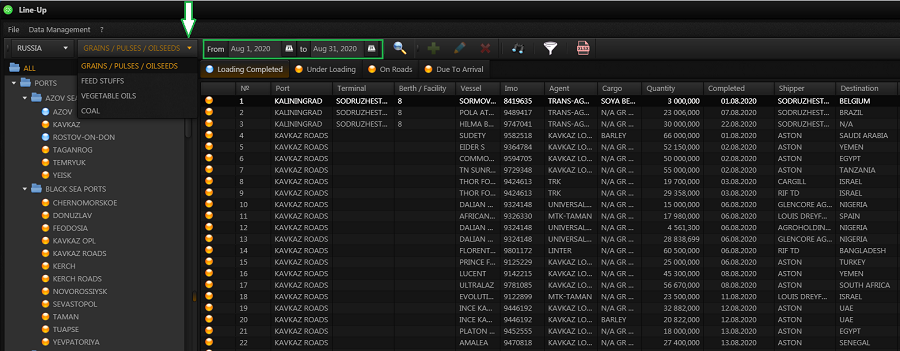
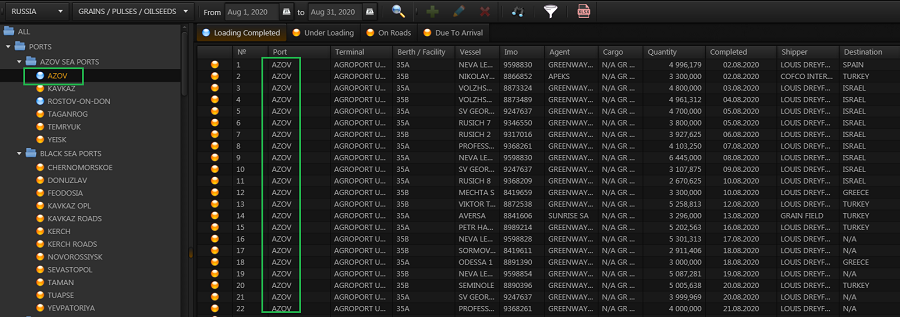
By selecting the port you are interested in on the left side of the interface, you will receive full analytics for it:
ships on the way
ships at anchorage
ships under loading
ships that have finished loading.
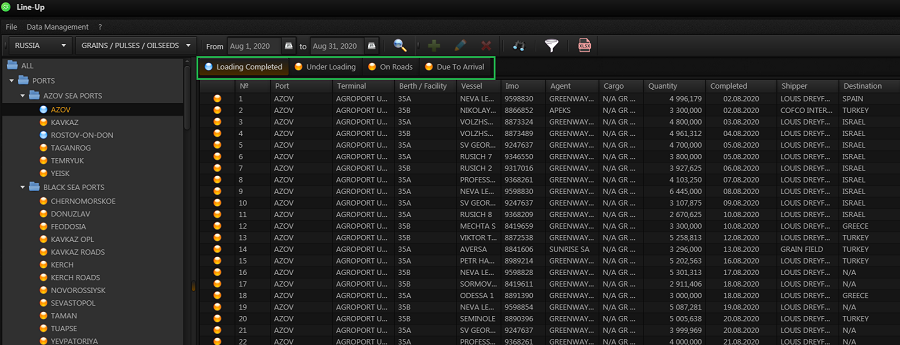
Use the tabs in the second menu bar to see which ships are on their way, at roadstead, loading or having finished loading.
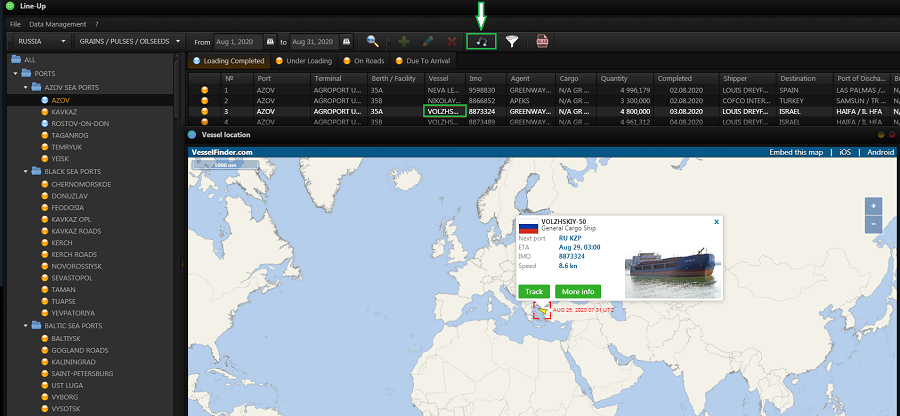
Also, users have the opportunity to see the location of any vessel in real time.
To do this, select the name of the vessel and click on the «binoculars» icon in the second menu line.
When you generate any report at the bottom of the interface, the total tonnage will be displayed according to the parameters you selected.
You can independently select the data you need in the published report through the filter: either by pressing the «filter» key in the first menu line, or open the filter by double-clicking on any column.
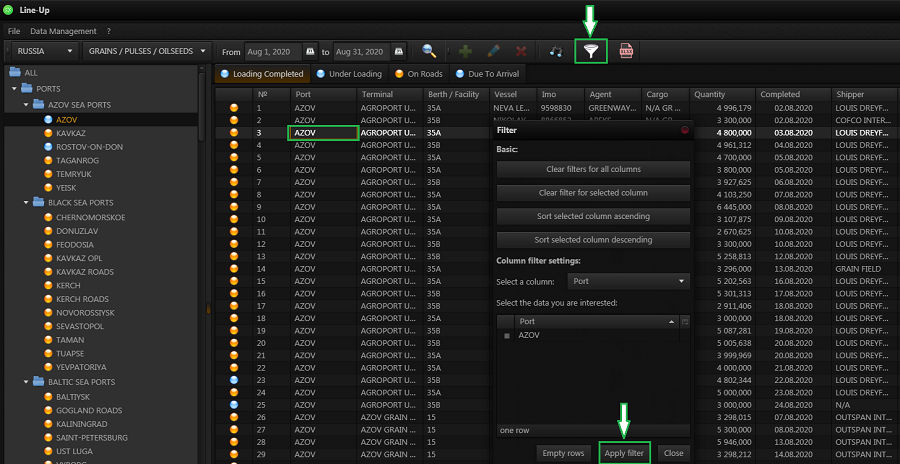
After selecting the necessary filters, press the «Apply filters» key.
You can download any report you received in Excel format by pressing the button in the top menu bar:
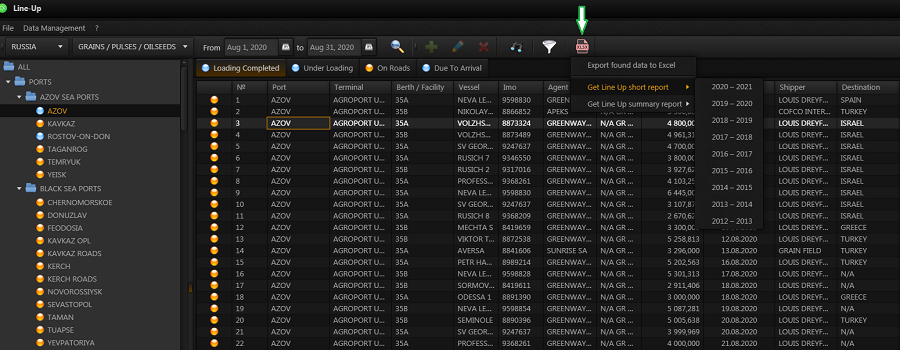
In the drop-down list, select the top line if you want to download the report that appeared on your screen, or select a year to download the archived report.
In the first case, you will receive the following report format:

It will fully match what you see on the application screen.
The second type of report is archived and is not tied to the dates that you specified when working with the application.
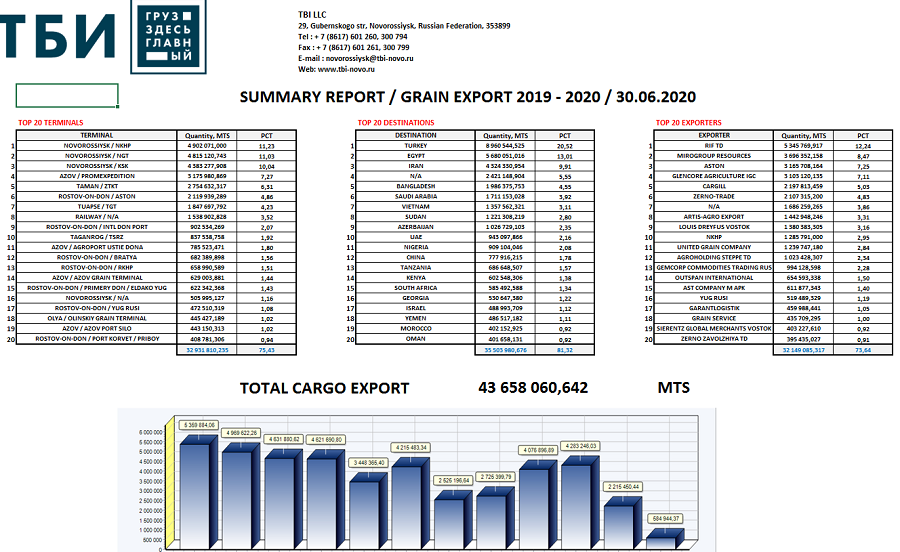
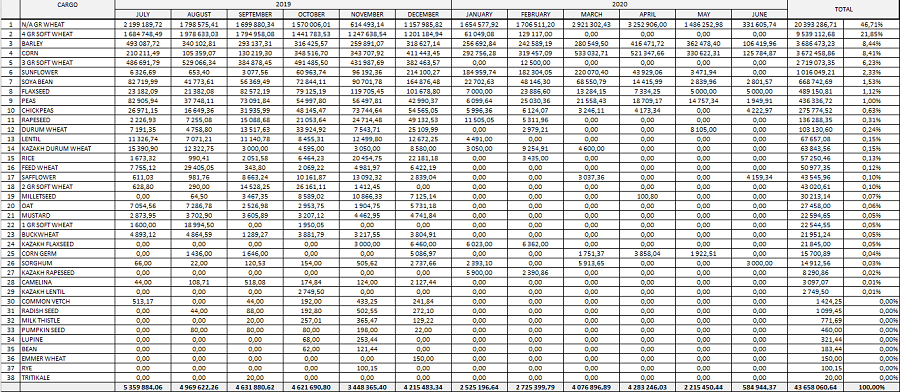
The report will contain information on TOP — 20 ports, cargoes, terminals, exporters and countries where the cargo was sent.
If you need an extended report in Excel format, you can download it in the «Ratings» application (see instructions for working with the report)
