The analytical platform Logistic OS is not only about receiving operational data on ports , but also the ability to conduct complete and versatile analytics.
The first half of 2020 has ended and against the backdrop of the consequences of the pandemic, I would like to compare some analytical data with the same period last year.
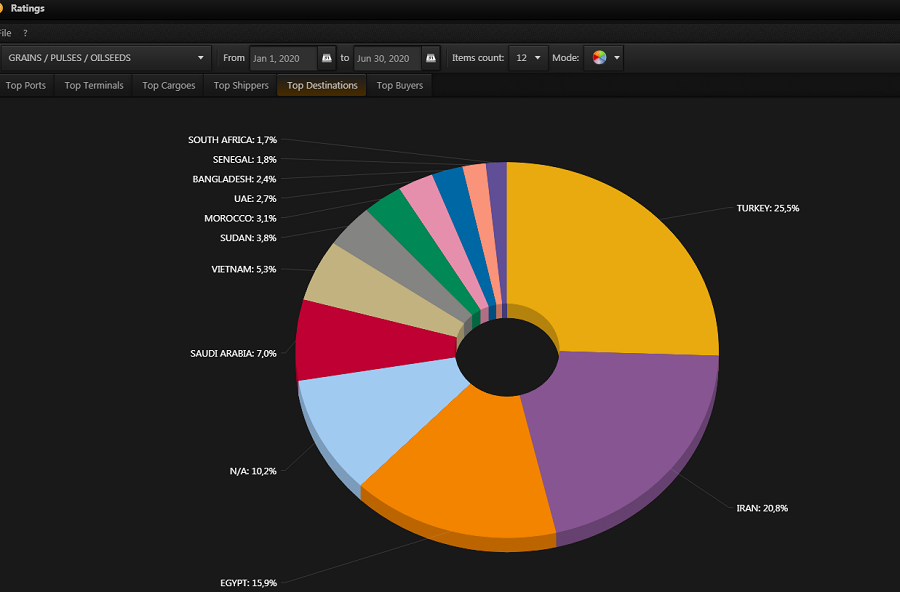
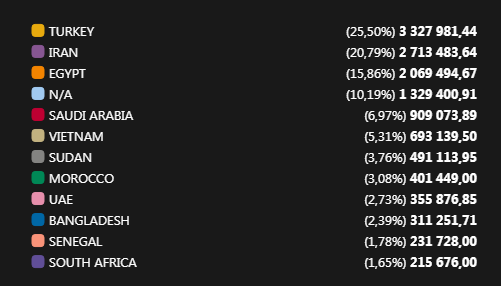
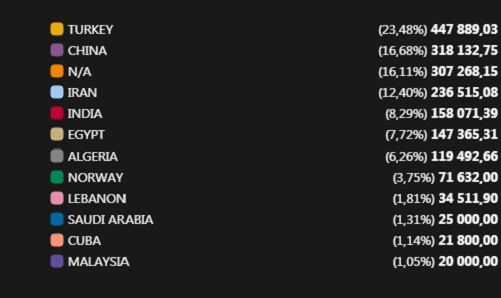
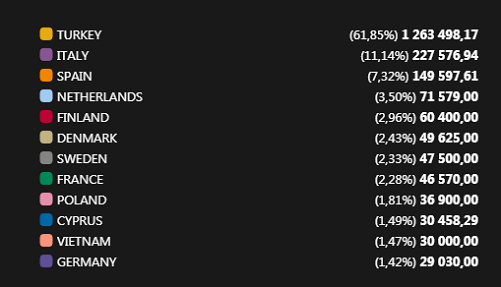
Let’s analyze the TOP-10 countries — importers of 2020.
Grain:
Total shipments: 16 435 thousand tons
2019 — 14 513 thousand tons
Growth + 13%
Vegetable oils:
Total shipments: 2,011 thousand tons
2019 — 2,003 thousand tons
Growth + 0.3%
Feed:
Total shipments: 2,196 thousand tons
2019 — 2,475 thousand tons
Fall -11%
According to the platform, the total volume of shipments for grain and vegetable oils has grown, despite the closure of borders amid the coronavirus pandemic and the introduction of quotas.
How to use the Logistic OS platform to carry out such an analysis?
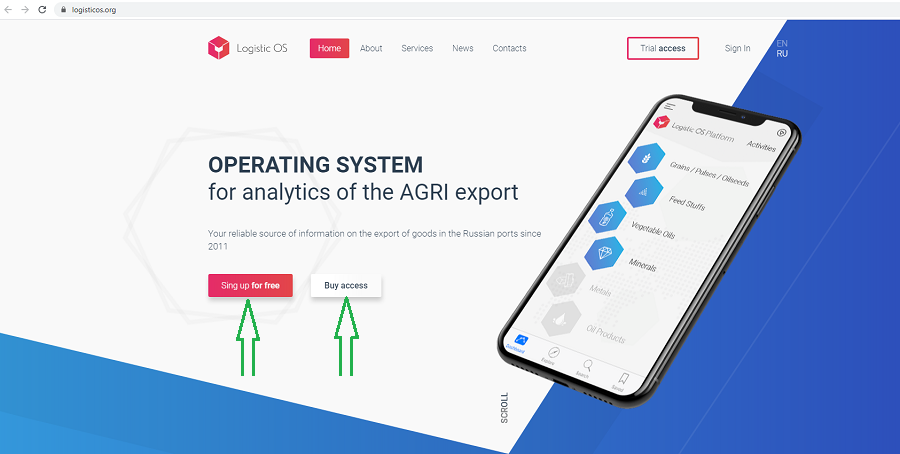
First you need to get access to work on the platform.
To do this, you need to send an application for either test access, or purchase a subscription to use the platform on an ongoing basis. This can be done on the home page of the site Logistic OS
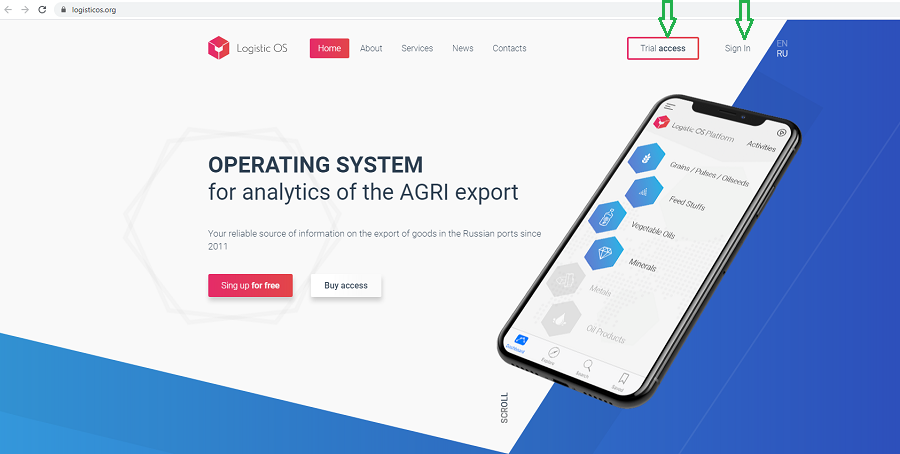
Then, having received your login and password, select the language you need and log in to the platform.
The appearance of the platform has a simple and intuitive interface that fully imitates a conventional computer operating system.
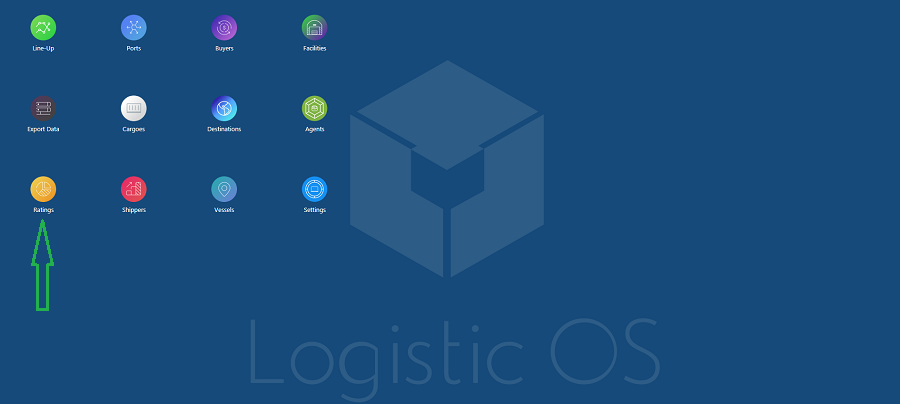
Any application opens with one click.
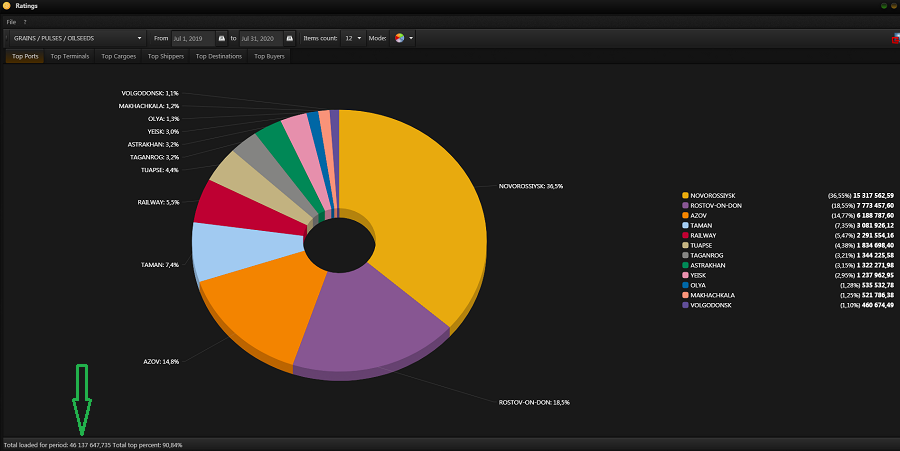
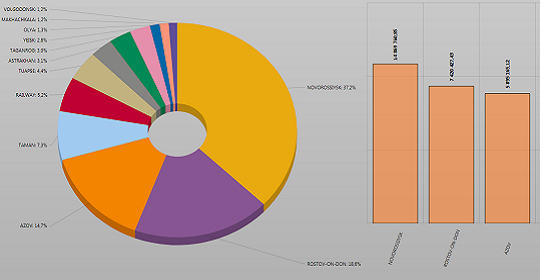
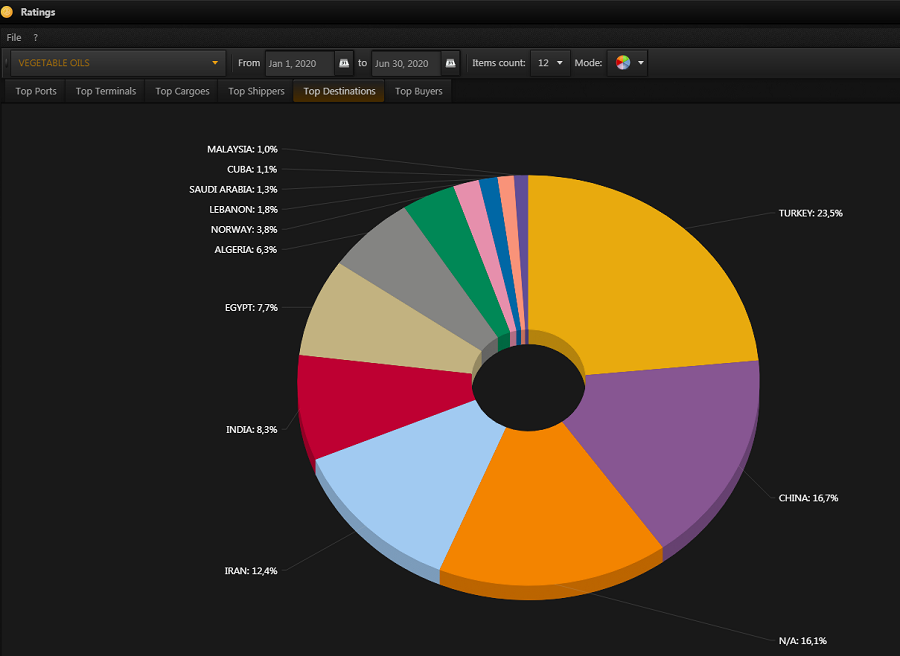
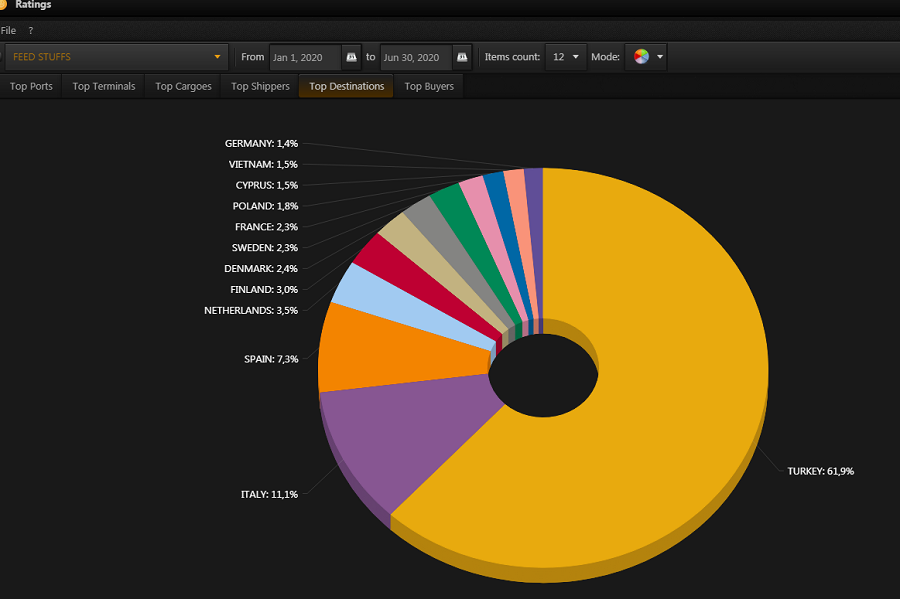
To carry out analytics similar to what we did earlier, we need to go to the Ratings application.
The following interface will open:
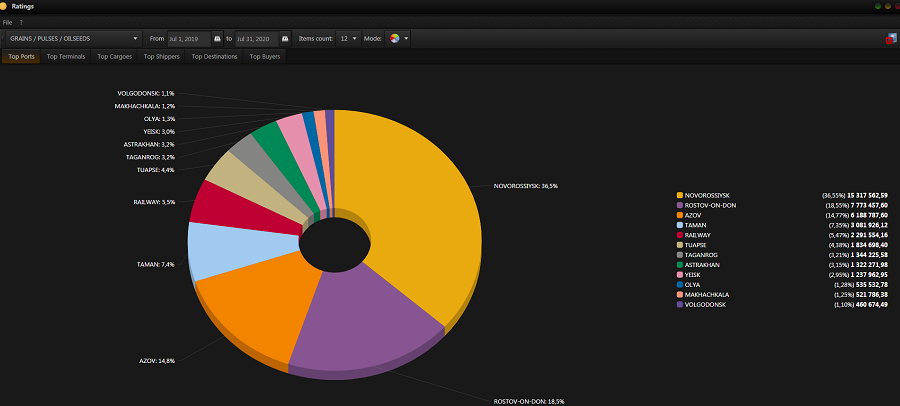
Analytical information is handled using the top toolbar.
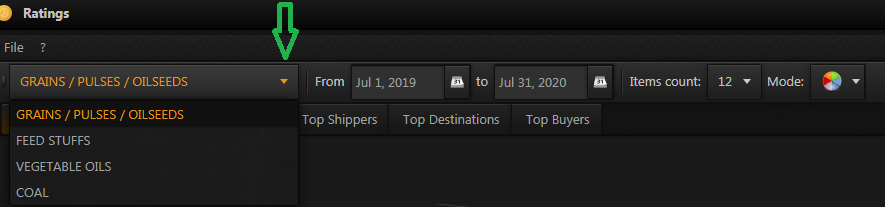
In the first window, you can select a group of products for which you want to analyze: click the yellow arrow and select it from the drop-down list.
It can be grain, vegetable oils, feed or coal (works in test mode).
Next, select the period for which you need to receive analytical data.
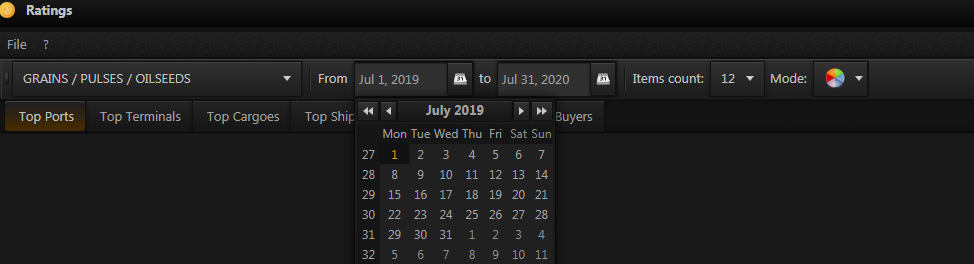
Select the start date of the period and the end date.
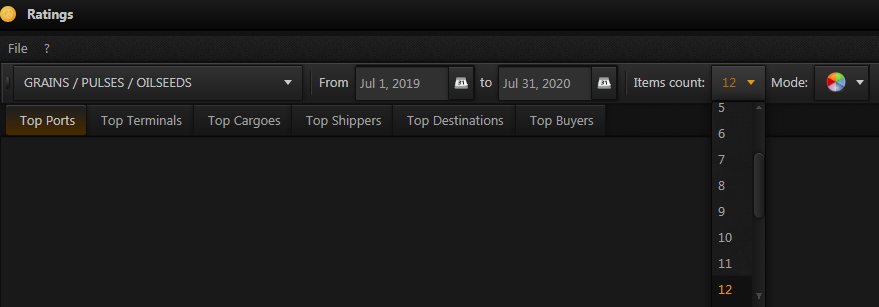
In the next drop-down list, you can select the number of items that will participate in the ranking.
Under the top command line, there are tabs through which you can select TOPs for which you can conduct analytics.
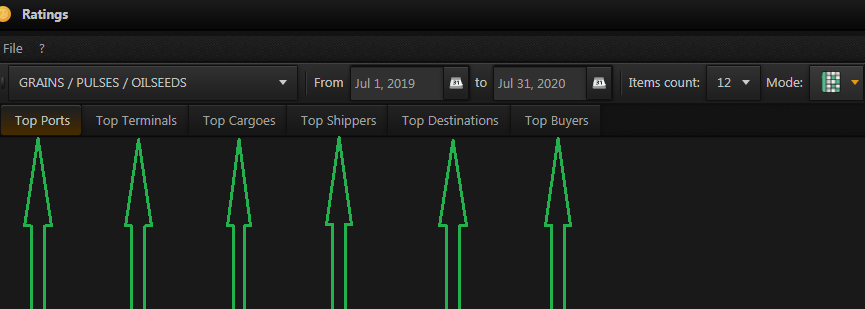
These are (from left to right): TOP ports , TOP terminals , TOP cargo , TOP shippers , TOP shipping directions and TOP buyers .
After you have set all the parameters you need, the program will generate the required diagram.
Thus, by setting the parameters in the upper toolbar, you will be able to view all TOPs without entering similar parameters again — they will be saved automatically.
At the same time, the bottom line will display the shipped tonnage and the percentage of TOPs in the total volume of shipments.